
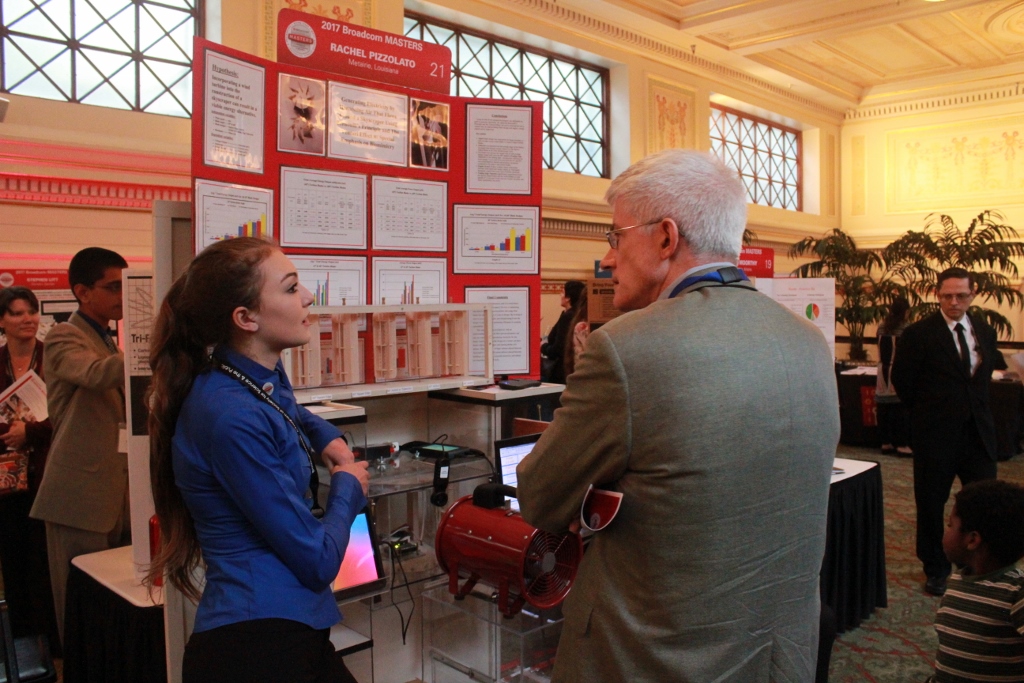
PROJECT RESEARCH

Improving 3D Printed Turbine Efficiency by Exploiting the “Lotus Effect” Through the Application of Silicon Nanoparticles to Turbine Blade Surfaces and Varying the Wind Diverter Angle of a Venturi
Since the beginning of the Industrial Revolution, the world has been using fossil fuels as a main source of energy. Although the machines have become much more efficient, the amount of pollution and wasted energy has been growing since the Industrial Revolution began. Before the Industrial Revolution, many machines didn’t use fossil fuels or cause pollution, and various naturally occurring power sources were used to power simple machines for many years. Wind and water power are some of the sources that were used to drive simple machines. Those sources produced little to no pollution, which was good for the environment.
The early Egyptians were very skilled in using muscle power because they routinely used the power of animals to raise water from the Nile to fill their irrigation channels. Also, they used man and animal power to raise large objects in order to transport them to far places. The Romans used man power to drive a treadwheel used to raise water and building materials. As a matter of fact, some form of the treadwheel was used in England up to the nineteenth century, and many of the machines are still seen in England.
Water has been a source of power as far back as 25 BC. Vitruvius described a wheel that was turned by a stream of water that traveled below it to power the water wheel. The water wheel was used to power a corn mill, and this process is still repeated all around the world today. Water power has been used for many things such as saw mills, grain mills, and irrigation. The water power has become increasingly more efficient as a result of better materials and more efficient ways of harnessing the power. Wind power has been around since 5000 BC when it was used to drive boats down the Nile River. Wind power was used to move water and to grind the grains by the Persians from 900 BC to 500 BC, and the windmill has been an important part of many cultures and is still used today. Since 1000 AD, they were also used to drain land for the Netherlands. Wind power and windmills were also used to satisfy the demand of lumber by powering the saws used to cut the wood needed to build cities. Wind power is an extremely important form of the energy production.
Wind tends to be the easiest source of energy to effectively harness on both large and small scales. Wind is everywhere and can be used to power mills, pump water out of the ground, generate electricity to power cities. Windmills are great in very windy areas because they have a non-stop power source. Windmills can be placed almost anywhere with the outcome of great results, and windmills can produce a lot of electricity. To do this, the windmill must turn a rotor that also spins a generator. When a windmill is used to produce energy, it is called a wind turbine, and today’s wind turbines are very complex. The angle of the blades, the spin rate of the turbine and the battery storage units all work in combination with complex computer software in order to extract the most energy possible from the wind. Because modern windmills are effective at producing electricity, they can be used for grinding grain and pumping water, in addition to generating electricity that can be used to power any electrical device. Even though the wind turbines help people produce electricity, they also have some detrimental effects on the environment. The rotating blades kill and injure animals flying in the air. Also, the turbines are very loud, and usually, they are set up in a very odd place because they are so large. Electricity has become a huge part of the world, and without electricity, the machines invented, the daily activity, and all of the modern conveniences would be no use to everyone who relies on electricity for their daily lives. According to the Wind Energy Foundation, installed global wind energy capacity was 318,000 MW in 2013, while according to the institute for Energy Research, wind power accounted for 4% of the power that was generated in the United States in 2013.
The wind turbine is a resource that provides electricity for the environment. Wind turbines can have a bladeless design and have a vertical or horizontal axis. Horizontal axis wind turbines have the motor on the top and are pointed towards the wind. Gear boxes are usually used to rotate the blades and make the generator spin faster. Usually the blades rotate up to 10-22 spins per minute. All of the wind turbines have protective features to protect the turbine from damage.
A vertical axis wind turbine usually has a gear box, and the turbine doesn’t need to be pointed to the wind. The blades are usually on the sides, and they are usually noisy. To have the speed increase, it could be hoisted onto a roof top, to possibly double its speed. A vertical axis turbine usually produces about 10 KW, while small horizontal turbines usually produce up to 5 KW. Old windmills were the predecessors of new modern wind turbines. The old windmills were much simpler than the turbines of today, but they both did the same job- They both captured wind. The blade of a wind turbine blade acts like the wings on an airplane because as the wind is blown on the blades they start to move. The shape of the blades causes them to spin because of the uneven pressure that develops over the edge of the blade. This is basically what happens on the wing of an airplane as the wind flows over the top edge. The blades are attached to a shaft called the rotor, and it only spins up to 18 RPM. The rotor shaft spins a bunch of gears and increases the speed to 1800 RPM. At 1800 RPM, the generator can begin to generate electricity.
Turbines are usually placed high in the air in order to catch the most wind, and more wind means more electricity. Larger turbines can also capture wind more efficiently, and the blades can sweep a circle in the air with a diameter longer than a football field. Even a small wind farm of modern turbines can generate enough electricity to power more than 9000 homes. Turbines can also capture wind in lakes and oceans, and the wind that is captured can be turned into electricity. Wind energy can be on land or on water, and still, they both provide a clean and efficient energy source that can contribute to the reduction in overall demand for electricity in the world.
A very important part of why wind turbines function as they do is due to the Bernoulli Principle. The Bernoulli Principle is one of the most important Principles known to man. Because of Bernoulli’s Principle, man has conquered the sky through the creation of the airplane. It is all due to the Bernoulli Principle. The curve in the wing of a plane causes the air to flow faster over the top of the wing at a lower pressure which generates lift, and the airplane rises. The same principles are at work when wind turbines capture the energy of the wind. The wind blows across the blades and due to Bernoulli’s Principle, The blades experience lift and the lift force acts to create torque which causes the blades to rotate on the hub of the turbine. Also at work is Newton’s third law of Motion which states that for every force that acts on an object, there is an equal and opposite reaction force exerted by the object. When the air sweeps across the blades, the blades push down on the air, and the air pushes up on the on the blades which causes lift. That lift is converted into torque and the blades react by rotating on the axis of the hub.
Another important principle that is of great importance in the design of effective wind turbines is the Venturi Effect. Since air is actually a fluid, it obeys the laws of Fluid Dynamics. And according to Bernoulli’s Principle, a region of fast flowing fluid exerts lower pressure on its surroundings than a region of slow flowing fluid. With that lower pressure, the fluid moves at much higher speeds than in the area of high pressure. The Venturi Effect makes use of the Bernoulli principle by creating a constricted area in a pipe, a hose nozzle or the space between two buildings. When the fluid flows through the constriction, the pressure decreases, and the speed of the fluid increases dramatically. The Venturi Effect has many uses that can be beneficial to all of mankind. It can be used to cool structures, increase head pressure in a garden hose or power wind turbines positioned between two towers of a skyscraper.
When harnessing the power of the wind, there are also many different ways to increase efficiency in wind turbines. One way is to use stronger and lighter materials when constructing wind turbines. Since Newton’s second law of motion states that:
F = ma
Force = F (Newton)
Mass = m (kg)
Acceleration = a (m/s 2)
For a given force of wind applied to a wind turbine, turbines with blades that possess less mass will experience greater acceleration than a turbine that has blades with more mass. Therefore, materials that are stronger and lighter tend to increase overall efficiency.
In addition to stronger and lighter materials, the shape and orientation of the blades can have a great impact on turbine efficiency. Increased surface area of the blades allows the turbine to extract more energy from the available wind source. However, larger turbines have some big disadvantages. They can be very intrusive because of their extremely large size. Also, the logistics of transporting them from factory to field and assembling the entire structure can be challenging. Also, the increased cost involved to design, build and maintain such massive structures, in certain cases, could prevent many potential customers from being able to afford such machines. One way to get around increasing the size of the turbine is to increase the efficiency of the design. The angle of the blades can be varied based on the wind speeds available, and by having adjustable blade angles incorporated into the design, wind turbines can increase overall efficiency in varying wind conditions.
Another way in which wind turbines can be made more efficient is by utilizing biomimicry in their design. Through using blades that incorporate “tubercles” into the design, wind turbines can exploit the highly efficient method that humpback whales use to “slide” through the ocean. The tubercles allow the whale flipper to experience more lift, less drag and an increased angle of attack without experiencing stall that occurs on standard airfoil wings. By incorporating such effective systems from nature into the design of modern wind turbines, turbine manufacturers have been able to increase the overall efficiency, while reducing the size and cost, of many wind turbines. When tubercles are incorporated on the wings edges, the air that flows over the surface of the wings tends to flow smoother with greater lift and less drag. Tubercles allow the surface of a wing to have a greater angle of attack before the wing starts to stall which means that it loses its ability to generate lift. It has been shown that Humpback Whales can put their fins at an angle of attack of roughly 14° before the loss of lift presents itself. However, for the wings of an airplane, when the angle of attack becomes greater than 10°, the possibility of the wings stalling increase rapidly. A 40% increase in the angle of attack for the wing allows the tubercle wing to capture much more energy from low-speed winds.
Many new techniques have been developed over the past few decades that have led to vast increases in turbine efficiency. One of the ways in which turbines have become increasingly efficient is using exotic materials in their construction. Carbon fiber and extremely strong and lightweight epoxies are now commonly used when designing and manufacturing turbine blades. The lighter and stronger the material used in the manufacture of turbine blades, the more efficient the resultant turbine becomes, and it allows the turbine to more efficiently extract the power from the wind. Stronger blades result in less deflection and twisting when the turbines are under stress, and result in extremely long service life. Since turbines are getting larger every year, with some of them now hundreds of feet in diameter, turbine blades need to continually be strengthened by using exotic materials that can take extreme stress over millions of rotations during the lifetime of the turbine.
With the onset of 3D printing, manufacturers can quickly construct scale models of CAD files and test their strength and durability. By using CAD software, designers and manufacturers can make instantaneous changes to the designs without the need for tooling and retooling machinery used to assemble the finished product. Vast numbers of scale model prototype turbine blade designs can be designed and tested by utilizing 3D printing technology which uses one machine to print out every variation of the design. It is no longer necessary to build large and extremely expensive machinery to produce prototype designs. One 3D printer can take the place of many machines that previously produced one specific part. Since 3D printers can print virtually any design that the designer can imagine, designs are only limited by the imagination of the designer and the strength and durability of the materials used. With the advent of cutting edge materials such as carbon nanotubes, graphene, and magnesium infused with silicon carbide nanoparticles, turbine blade design, efficiency, and durability is destined to improve over the coming decades.

Materials and Procedures:
Stat
Materials
- 3D printed scale model turbines
- 4 DC motors
- 2-12 Volt Stepper Motors
- 2- 24”x48” Sheets of acrylic glass
- 1/8” & 1/4” Acrylic rods
- Acrylic adhesive
- JB Weld (2 part epoxy)
- 1 Large industrial blower/fan wind testing
- Voltage meter
- LED bulbs
- Vernier Logger Pro 3 software
- Vernier Labquest 2 interface
- Vernier anemometer
- Vernier energy sensor
- Vernier variable load
- Laptop computer
- Raspberry Pi computer
- Raspberry Pi Stepper Motor Hat
- 12 Volt
- Fusion 360 CAD software
- Nanoparticles to test “Lotus Effect”
- 3D printer
- Paint
- Superglue
- Plywood 30”x 48”
- Duct tape
- Electrical wire
- Electrical connectors
- Electrical tape
- Drill
- Drill bit assortment
- Sandpaper
- Nail gun
- Router
- Fluted and trim router bits
- Saw
- Screwdrivers
- Hot glue gun
- Razer knife
- Soldering iron
- Solder
- Heat shrink tubing
- Hair dryer
- Pliers
- Safety Goggles
- Assorted nuts, bolts, and screws
- Parent to supervise use of tools
Procedure:
Carefully measure the pieces that will be cut from the two sheets of Acrylic glass. Four pieces will be needed for the sides of the model skyscrapers, and 1 piece will be needed for the top. Assemble the pieces with acrylic adhesive and allow it to dry thoroughly. Repeat the process for the other tower.
Design the turbines using CAD software and 3D print the turbines in High Detail Resin. Assemble the blades for the turbine and mount the blades to the DC motors. Apply nanoparticles to the experimental wind turbines. After the wind turbines are assembled, build the venturi and mount it into the structure of the skyscrapers. Position the wind turbines at the exit of the venturi to take full advantage of the directed airflow. Connect the 60° Airfoil w/ Trailing Edge Tubercles to the voltmeter with electrical wire and electrical connectors. Spin the turbines to test for voltage output. Mount each tower to the plywood base and position the fan in front of the towers. Hook up the Vernier energy sensor to the turbine after attaching the variable load to the turbines.
Turn on the fan, and use the anemometer to test the wind speed in front of each tower. Set the fan at the lowest speed that allows the blades to start turning, and measure the wind speed in front of the towers and take note of the output on the computer readout. After performing 10 trials with 1000 measurements/trial, increase the wind speed and repeat the process for 10 trials at each wind speed. Each trial is 100 seconds in duration and measurements will be taken at 1/10 second intervals. The measurements will include voltage in millivolts (mV), current in milliamps (mA), power in milliwatts (mW), total energy in millijoules (mJ), wind speed in meters/second (m/s), and load on the system in Ohms (Ω). Once all the measurements are made with the first turbine blade (Control), test the turbines that have nanoparticles (Experimental) applied to the blade surfaces. Change the turbines to the 45° Airfoil w/ Trailing Edge Tubercles and test the (Control) and the (Experimental) turbines for 10 trials at each wind speed. Determine the slowest wind speed to get the turbines started and conduct 10 trials at each wind speed. Repeat the same procedure for the 45° & 60° Airfoils w/ Leading Edge Tubercles.
Once all the trials are done with the venturi diverters at the mouth of the venturi completely open, vary the diverter angle to determine the angle where the turbines produce the most output.
Risk and Safety:
Teacher (mentor) or parents will supervise in this experiment. Gloves and safety glasses will be used during the entire experiment. Extreme care will be taken when sawing or cutting all materials. All exposed wiring will be covered with electrical connectors or electrical tape. A fire extinguisher will be available during the experiment. Student researcher regularly works with tools listed in the materials list, but a parent will still be present to supervise.
Data Analysis:
Once the testing is performed, the data will be assembled in table form for analysis. Averages will be computed for each variable, and they will be used to compare the different turbine blade angles (45° and 60°), designs (Airfoil w/ Trailing Edge Tubercles and Airfoil w/ Leading Edge Tubercles), and diverter angles. Amperage (mA), voltage (mV), power output (mW) and energy output (mJ) will be compared in order to determine the amount of electricity produced by each turbine at each wind speed (m/s). The data will also be processed to determine the difference in (mA), (mV), (mW) and (mJ) at each wind speed (m/s) for each blade design, blade angle and diverter angle, and compared to determine whether one blade design or angle results in improved output over the others and which diverter angle produces the most output. The data will then be analyzed to determine whether the results are significant. Statistical tests will be performed to find the average (mean), standard deviation (SD), and delta (Δ) of each measured parameter. Also, t-tests (p<.05) will be performed for all trials and variables. If the turbines treated with nanoparticles produce a significant increase in amperage (mA), voltage (mV), power (mW) or energy (mJ) versus the non-treated turbines, then my hypothesis will be accepted. If the turbines treated with nanoparticles fail to produce an increase in amperage (mA), voltage (mV), power (mW) or energy (mJ) versus the non-treated turbines, then my hypothesis will be rejected.

Research Plan
Research Plan
Project Rationale:
Wind Energy Year III: The purpose of this experiment is to find the position of the wind diverters where the turbines produce the most electricity by incorporating a Raspberry Pi computer into the structure that adjusts the diverter doors at the opening of the venturi. Also, nanoparticle technology will be applied to the surfaces of the experimental wind turbines, and the electrical output will be compared to that of the control to determine whether the effects of friction on the turbine blades can be reduced. Since the use of fossil fuels is detrimental to the environment, and the entire human and animal population, exploring alternative ways to produce electricity is imperative to the future of humans. The experiment will generate electricity by driving 3D printed turbines, while adjusting the opening to the venturi that houses the turbines with a Raspberry Pi computer and stepper motors, with the air that flows around a skyscraper utilizing Bernoulli’s Principle and the Venturi Effect. Special emphasis on biomimicry will be explored by testing the “Lotus Effect” through the application of nanoparticles to the surfaces of the experimental turbine blades. Data will be collected using Vernier’s Logger Pro 3.14 software and energy sensors.
Hypothesis:
By applying nanoparticles to the surfaces of the experimental turbines, and by varying the angle of the diverter doors at the opening of a venturi that houses electrical turbines, turbine efficiency can be improved.
Variables:
- Independent Variables:
- Wind speed —- m/s
- Venturi Diverter Angles—degrees (°)
- Nanoparticles (Treated & Non-Treated Turbines)
- Blade Angle—- 45° & 60°
- Resistance —— Ohms (Ω)
- Blade Designs — Airfoil w/ Trailing Edge Tubercles & Airfoil w/ Leading Edge Tubercles
- Dependent Variables:
- Voltage output —————- Potential (mV)
- Amperage ——————— Current (mA)
- Power Output —————– Watts (mW)
- Total Energy Produced —— Joules (mJ)
- Constants:
- Ambient weather and temperature will be the same in all the trials.
- The computer software and hardware will be calibrated and used for all trials to ensure the accuracy of data collection.
Research Question:
Will Varying the angle of the diverter doors at the opening of a venturi that houses electrical turbines improve the turbine’s electrical output, and will the application of nanoparticles to the surfaces of the experimental turbines improve turbine efficiency?
Expected Outcome:
I expect that the 3D printed turbine blades will allow for more consistent measurements across all the turbine designs. This will occur because of the ability of the 3D printer to accurately reproduce each turbine blade with a high degree of precision. I expect that the turbine blades that are treated with nanoparticles will result in a more efficient design. I also feel that adjusting the diverter doors will result in the ability to find a “sweet spot” where the turbines produce the most electricity.
Hypothesis and Variables
Hypothesis:
By applying nanoparticles to the surfaces of the experimental turbines, and by varying the angle of the diverter doors at the opening of a venturi that houses electrical turbines, turbine efficiency can be improved.
Variables:
Independent variables:
- Wind speed —- m/s
- Venturi Diverter angles—degrees (°)
- Nanoparticles (Treated & Non-Treated Turbines)
- Blade Angle—- 45° & 60°
- Resistance —— Ohms (Ω)
- Blade designs — Airfoil w/ Trailing Edge Tubercles & Airfoil w/ Leading Edge Tubercles
Dependent variables:
- Voltage output —————- Potential (mV)
- Amperage ——————— Current (mA)
- Power output —————– Watts (mW)
- Total Energy Produced —– Joules (mJ)
Constants:
- Ambient weather and temperature will be the same for all the trials.
- The calibrated Vernier software and hardware will be used for all trials to ensure the accuracy of data collection.
45° Trailing Edge Tubercles @ 3.9 m/s- Diverter Doors @ 0°-18.0°
Average Output of Each Variable
|
Variable |
0° | 1.8° | 3.6° | 5.4° | 7.2° | 9.0° | 10.8° | 12.6° | 14.4° | 16.2° | 18.0° |
| Voltage (mV) | 938.4 | 922.0 | 955.0 | 947.3 | 957.7 | 947.5 | 939.6 | 950.9 | 935.2 | 932.5 | 914.1 |
| Current (mA) | 117.5 | 120.7 | 123.0 | 122.0 | 123.5 | 123.1 | 122.1 | 123.9 | 121.9 | 121.5 | 119.2 |
| Power (mW)110.3 | 111.5 | 117.7 | 115.7 | 118.5 | 116.8 | 115.0 | 117.9 | 114.2 | 113.5 | 109.1 | |
| Energy (mJ) | 11029.2 | 11146.9 | 11765.5 | 11573.0 | 11849.1 | 11679.0 | 11498.7 | 11793.1 | 11420.5 | 11355.7 | 10908.9 |
| Wind Speed (m/s) | 3.9 | 3.8 | 3.8 | 3.9 | 3.9 | 3.9 | 3.8 | 3.9 | 3.9 | 3.9 | 3.8 |
Table 1 1001 Samples/Trial *Resisistance = 7 Ohms
45° Trailing Edge Tubercles + Nanoparticles @ 3.9 m/s- Diverter Doors @ 0°-18.0°
Average Output of Each Variable
|
Variable |
0° | 1.8° | 3.6° | 5.4° | 7.2° | 9.0° | 10.8° | 12.6° | 14.4° | 16.2° | 18.0° |
| Voltage (mV) | 1328.0 | 1328.0 | 1341.0 | 1359.0 | 1353.0 | 1346.0 | 1337.0 | 1344.0 | 1344.0 | 1332.0 | |
| Current (mA) | 145.5 | 146.0 | 146.5 | 147.7 | 148.2 | 147.7 | 146.5 | 145.6 | 144.8 | 143.1 | |
| Power (mW) | 193.3 | 194.0 | 196.6 | 200.9 | 200.7 | 199.0 | 196.0 | 195.8 | 194.7 | 190.7 | |
| Energy (mJ) | 19332.3 | 19401.6 | 19660.5 | 20086.4 | 20066.0 | 19896.7 | 19605.6 | 19582.5 | 19474.1 | 19068.4 | |
| Wind Speed (m/s) | 3.8 | 3.8 | 3.8 | 3.9 | 3.9 | 3.8 | 3.8 | 3.9 | 3.9 | 3.8 |
Table 2 1001 Samples/Trial *Resisistance = 7 Ohms
60° Trailing Edge Tubercles @ 3.9 m/s w/ Diverter Doors @ 0°-18.0°
Average Output of Each Variable
|
Variable |
0° | 1.8° | 3.6° | 5.4° | 7.2° | 9.0° | 10.8° | 12.6° | 14.4° | 16.2° | 18.0° |
| Voltage (mV) | 1031.7 | 1041.0 | 1057.0 | 1066.0 | 1055.0 | 1076.0 | 1083.0 | 1071.0 | 1068.0 | 1051.0 | 1045.0 |
| Current (mA) | 116.0 | 116.9 | 117.6 | 118.1 | 117.8 | 121.8 | 119.8 | 119.5 | 119.3 | 120.0 | 117.9 |
| Power (mW) | 119.7 | 122.0 | 124.4 | 126.1 | 124.6 | 131.3 | 130.0 | 128.3 | 127.6 | 126.3 | 123.3 |
| Energy (mJ) | 11968.8 | 12198.0 | 12444.1 | 12606.3 | 12456.3 | 13125.4 | 12997.9 | 12824.3 | 12765.4 | 12633.8 | 12330.3 |
| Wind Speed (m/s) | 3.9 | 3.9 | 4.0 | 4.0 | 4.0 | 4.0 | 4.1 | 4.0 | 4.1 | 4.2 | 4.1 |
Table 3 1001 Samples/Trial *Resisistance = 7 Ohms
60° Trailing Edge Tubercles + Nanoparticles @ 3.9 m/s- Diverter Doors @ 0°-18.0°
Average Output of Each Variable
|
Variable |
0° | 1.8° | 3.6° | 5.4° | 7.2° | 9.0° | 10.8° | 12.6° | 14.4° | 16.2° | 18.0° |
| Voltage (mV) | 1167.6 | 1185.0 | 1182.0 | 1186.0 | 1188.0 | 1187.0 | 1178.0 | 1177.0 | 1167.0 | 1150.0 | 1135.0 |
| Current (mA) | 148.5 | 148.2 | 148.0 | 148.4 | 148.8 | 148.6 | 147.5 | 147.3 | 146.0 | 143.7 | 141.8 |
| Power (mW) | 173.4 | 175.7 | 175.0 | 176.1 | 176.9 | 176.5 | 173.8 | 173.6 | 170.6 | 165.3 | 161.1 |
| Energy (mJ) | 17339.3 | 175688.4 | 1504.5 | 17604.3 | 17687.3 | 17647.6 | 17377.3 | 17356.4 | 17062.2 | 16532.5 | 16106.0 |
| Wind Speed (m/s) | 3.9 | 3.9 | 3.9 | 3.8 | 3.9 | 3.9 | 3.9 | 3.9 | 4.0 | 4.0 | 4.0 |
Table 4 1001 Samples/Trial *Resisistance = 7 Ohms
45° Leading Edge Tubercles @ 3.9 m/s- Diverter Doors @ 0°-18.0°
Average Output of Each Variable
|
Variable |
0° | 1.8° | 3.6° | 5.4° | 7.2° | 9.0° | 10.8° | 12.6° | 14.4° | 16.2° | 18.0° |
| Voltage (mV) | 885.7 | 894.2 | 902.8 | 913.9 | 913.3 | 923.9 | 927.1 | 899.2 | 913.0 | 903.5 | 896.8 |
| Current (mA) | 112.0 | 111.9 | 112.7 | 114.0 | 113.8 | 115.1 | 115.5 | 111.9 | 113.7 | 112.3 | 111.2 |
| Power (mW) | 99.2 | 100.3 | 101.9 | 104.0 | 104.2 | 106.5 | 107.3 | 100.8 | 104.0 | 101.6 | 99.9 |
| Energy (mJ) | 9919.7 | 10030.6 | 10190.7 | 10436.6 | 10418.5 | 10648.6 | 10724.7 | 10020.7 | 10396.9 | 10164.2 | 9991.1 |
| Wind Speed (m/s) | 3.9 | 3.9 | 3.9 | 3.9 | 3.8 | 3.9 | 4.0 | 3.9 | 3.9 | 3.9 | 4.0 |
Table 5 1001 Samples/Trial *Resisistance = 7 Ohms
45° Leading Edge Tubercles + Nanoparticles @ 3.9 m/s- Diverter Doors @ 0°-18.0°
Average Output of Each Variable
|
Variable |
0° | 1.8° | 3.6° | 5.4° | 7.2° | 9.0° | 10.8° | 12.6° | 14.4° | 16.2° | 18.0° |
| Voltage (mV) | 1174.3 | 1206.0 | 1209.0 | 1211.0 | 1201.0 | 1206.0 | 1192.0 | 1204.0 | 1169.0 | 1176.0 | 1162.0 |
| Current (mA) | 120.4 | 126.2 | 126.8 | 127.2 | 127.1 | 127.9 | 126.3 | 127.6 | 123.9 | 124.8 | 123.2 |
| Power (mW) | 141.5 | 152.3 | 153.5 | 154.3 | 152.8 | 154.4 | 150.6 | 153.7 | 145.1 | 146.9 | 143.2 |
| 143.2Energy (mJ) | 14145.2 | 15233.5 | 15354.7 | 15426.8 | 15282.9 | 15441.1 | 15064.6 | 15368.5 | 14512.3 | 14691.4 | 14324.1 |
| Wind Speed (m/s) | 3.8 | 3.9 | 3.9 | 3.9 | 3.9 | 3.9 | 3.9 | 4.0 | 3.9 | 3.9 | 3.9 |
Table 6 1001 Samples/Trial *Resisistance = 7 Ohms
60 ° Leading Edge Tubercles @ 3.9 m/s- Diverter Doors @ 0°-18.0°
Average Output of Each Variable
|
Variable |
0° | 1.8° | 3.6° | 5.4° | 7.2° | 9.0° | 10.8° | 12.6° | 14.4° | 16.2° | 18.0° |
| Voltage (mV) | 946.5 | 941.2 | 948.8 | 953.8 | 973.6 | 971.2 | 973.7 | 940.8 | 949.5 | 955.5 | 955.0 |
| Current (mA) | 106.5 | 108.3 | 108.9 | 108.5 | 110.2 | 110.0 | 111.4 | 108.1 | 109.4 | 109.6 | 109.2 |
| Power (mW) | 100.8 | 102.1 | 103.7 | 103.8 | 107.5 | 107.1 | 108.8 | 101.9 | 104.2 | 105.0 | 104.5 |
| Energy (mJ) | 10077.2 | 10212.8 | 10369.3 | 10375.6 | 10749.7 | 10710.8 | 10877.5 | 101192.2 | 10418.4 | 10500.8 | 10446.5 |
| Wind Speed (m/s) | 3.9 | 3.9 | 3.8 | 3.8 | 3.9 | 3.9 | 3.9 | 3.8 | 3.9 | 3.9 | 4.0 |
Table 7 1001 Samples/Trial *Resisistance = 7 Ohms
60° Leading Edge Tubercles + Nanoparticles @ 3.9 m/s- Diverter Doors @ 0°-18.0°
Average Output of Each Variable
|
Variable |
0° | 1.8° | 3.6° | 5.4° | 7.2° | 9.0° | 10.8° | 12.6° | 14.4° | 16.2° | 18.0° |
| Voltage (mV) | 917.2 | 936.2 | 948.8 | 947.7 | 953.1 | 957.7 | 960.2 | 952.8 | 957.9 | 943.3 | 936.8 |
| Current (mA) | 127.8 | 130.0 | 131.6 | 131.5 | 132.1 | 132.6 | 133.0 | 132.0 | 132.6 | 130.6 | 129.8 |
| Power (mW) | 117.2 | 121.8 | 125.0 | 124.8 | 126.1 | 127.1 | 127.8 | 125.9 | 127.1 | 123.3 | 121.8 |
| Energy (mJ) | 11725.1 | 12184.3 | 12503.8 | 12476.9 | 12610.2 | 12712.7 | 12780.9 | 12592.7 | 12714.3 | 12333.9 | 12176.6 |
| Wind Speed (m/s) | 3.9 | 3.8 | 3.8 | 3.8 | 3.9 | 3.8 | 3.8 | 3.8 | 3.9 | 3.9 | 3.9 |
Table 8 1001 Samples/Trial *Resisistance = 7 Ohms
45° Trailing Edge Tubercles @ 5.0 m/s- Diverter Doors @ 0°-18.0°
Average Output of Each Variable
|
Variable |
0° | 1.8° | 3.6° | 5.4° | 7.2° | 9.0° | 10.8° | 12.6° | 14.4° | 16.2° | 18.0° |
| Voltage (mV) | 1244.7 | 1243.0 | 1253.0 | 1281.0 | 1282.0 | 1293.0 | 1322.0 | 1309.0 | 1300.0 | 1231.0 | 1220.0 |
| Current (mA) | 159.9 | 159.8 | 161.3 | 164.6 | 164.7 | 166.1 | 151.7 | 163.4 | 162.4 | 154.2 | 152.9 |
| Power (mW) | 199.0 | 198.7 | 202.3 | 211.0 | 211.3 | 214.9 | 217.0 | 214.0 | 211.3 | 189.9 | 186.7 |
| Energy (mJ) | 19904.1 | 19867.2 | 20225.0 | 21102.6 | 21126.7 | 21493.6 | 21703.5 | 21405.6 | 21128.8 | 18994.8 | 18669.9 |
| Wind Speed (m/s) | 5.4 | 5.4 | 5.4 | 5.5 | 5.5 | 5.5 | 5.6 | 5.5 | 5.5 | 5.2 | 5.2 |
Table 9 1001 Samples/Trial *Resisistance = 7 Ohms
45° Trailing Edge Tubercles + Nanoparticles @ 5.0 m/s- Diverter Doors @ 0°-18.0°
Average Output of Each Variable
|
Variable |
0° | 1.8° | 3.6° | 5.4° | 7.2° | 9.0° | 10.8° | 12.6° | 14.4° | 16.2° | 18.0° |
| Voltage (mV) | 1412.0 | 1426.0 | 1448.0 | 1369.0 | 1456.0 | 1490.0 | 1479.0 | 1492.0 | 1489.0 | 1516.0 | |
| Current (mA) | 166.9 | 167.7 | 170.0 | 170.6 | 171.4 | 172.1 | 170.3 | 170.7 | 169.0 | 165.0 | |
| Power (mW) | 235.7 | 239.3 | 246.3 | 247.5 | 249.8 | 256.6 | 252.0 | 254.7 | 251.6 | 250.3 | |
| Energy (mJ) | 23572.7 | 23925.2 | 24634.8 | 24745.8 | 24975.8 | 25660.1 | 25204.5 | 25466.7 | 25162.9 | 25027.0 | |
| Wind Speed (m/s) | 5.0 | 5.0 | 5.0 | 5.0 | 5.0 | 5.1 | 5.0 | 5.0 | 5.1 | 5.0 |
Table 10 1001 Samples/Trial *Resisistance = 7 Ohms
60° Trailing Edge Tubercles @ 5.0 m/s w/ Diverter Doors @ 0°-18.0°
Average Output of Each Variable
|
Variable |
0° | 1.8° | 3.6° | 5.4° | 7.2° | 9.0° | 10.8° | 12.6° | 14.4° | 16.2° | 18.0° |
| Voltage (mV) | 827.2 | 850.3 | 863.3 | 875.0 | 876.0 | 870.7 | 871.0 | 870.2 | 860.5 | 858.0 | 857.9 |
| Current (mA) | 100.0 | 102.6 | 103.8 | 105.1 | 105.1 | 104.5 | 104.4 | 104.5 | 103.1 | 102.8 | 102.7 |
| Power (mW) | 82.8 | 87.4 | 89.8 | 92.1 | 92.2 | 91.1 | 91.1 | 91.1 | 88.9 | 88.3 | 88.2 |
| Energy (mJ) | 8274.6 | 8740.7 | 8977.6 | 9211.3 | 9223.6 | 9110.2 | 9105.7 | 9109.2 | 8884.5 | 8830.0 | 8823.4 |
| Wind Speed (m/s) | 4.9 | 5.1 | 5.1 | 5.2 | 5.3 | 5.2 | 5.3 | 5.3 | 5.3 | 5.4 | 5.3 |
Table 11 1001 Samples/Trial *Resisistance = 7 Ohms
60° Trailing Edge Tubercles + Nanoparticles @ 5.0 m/s- Diverter Doors @ 0°-18.0°
Average Output of Each Variable
|
Variable |
0° | 1.8° | 3.6° | 5.4° | 7.2° | 9.0° | 10.8° | 12.6° | 14.4° | 16.2° | 18.0° |
| Voltage (mV) | 1325.9 | 1306.0 | 1311.0 | 1315.0 | 1312.0 | 1314.0 | 1302.0 | 1289.0 | 1285.0 | 1275.0 | 1259.0 |
| Current (mA) | 160.2 | 163.9 | 164.6 | 165.2 | 164.8 | 165.0 | 163.4 | 161.7 | 161.1 | 159.9 | 157.8 |
| Power (mW) | 212.4 | 214.2 | 215.9 | 217.3 | 216.4 | 217.0 | 212.9 | 208.6 | 207.2 | 204.0 | 198.8 |
| Energy (mJ) | 21242.4 | 21421.8 | 21589.8 | 21734.1 | 21639.5 | 21698.0 | 21290.0 | 20861.2 | 20720.4 | 20400.2 | 19882.0 |
| Wind Speed (m/s) | 5.0 | 4.9 | 5.0 | 5.0 | 5.0 | 5.0 | 5.0 | 5.0 | 5.1 | 5.1 | 5.1 |
Table 12 *1001 Samples/Trial *Resistance = 7 Ohms
45° Leading Edge Tubercles @ 5.0 m/s- Diverter Doors @ 0°-18.0°
Average Output of Each Variable
|
Variable |
0° | 1.8° | 3.6° | 5.4° | 7.2° | 9.0° | 10.8° | 12.6° | 14.4° | 16.2° | 18.0° |
| Voltage (mV) | 1128.4 | 1110.0 | 1147.0 | 1139.0 | 1134.0 | 1150.0 | 1164.0 | 1166.0 | 1163.0 | 1160.0 | 1153.0 |
| Current (mA) | 139.3 | 138.5 | 143.2 | 142.2 | 141.4 | 143.4 | 145.1 | 145.3 | 144.8 | 144.4 | 143.5 |
| Power (mW) | 157.2 | 154.0 | 164.4 | 162.1 | 160.5 | 165.1 | 169.1 | 169.5 | 168.6 | 167.6 | 165.5 |
| Energy (mJ) | 1571.8 | 15397.5 | 16439.3 | 16207.3 | 16052.8 | 16514.0 | 16906.9 | 16956.2 | 16855.2 | 16757.1 | 16551.1 |
| Wind Speed (m/s) | 5.0 | 4.7 | 4.9 | 4.8 | 4.9 | 4.8 | 4.9 | 5.0 | 5.0 | 5.0 | 5.0 |
Table 13 *1001 Samples/Trial *Resistance = 7 Ohms
45° Leading Edge Tubercles + Nanoparticles @ 5.0 m/s- Diverter Doors @ 0°-18.0°
Average Output of Each Variable
|
Variable |
0° | 1.8° | 3.6° | 5.4° | 7.2° | 9.0° | 10.8° | 12.6° | 14.4° | 16.2° | 18.0° |
| Voltage (mV) | 1343.4 | 1336.0 | 1339.0 | 1346.0 | 1340.0 | 1344.0 | 1341.0 | 1350.0 | 1346.0 | 1335.0 | 1323.0 |
| Current (mA) | 140.3 | 143.3 | 144.1 | 144.9 | 144.7 | 145.2 | 146.5 | 146.1 | 145.8 | 146.3 | 145.2 |
| Power (mW) | 188.5 | 191.7 | 193.1 | 195.2 | 194.0 | 195.2 | 196.5 | 197.4 | 196.3 | 195.4 | 192.1 |
| Energy (mJ) | 18846.5 | 19165.7 | 19306.4 | 19517.0 | 19404.2 | 19522.1 | 19647.3 | 19737.8 | 19630.2 | 19539.3 | 19213.8 |
| Wind Speed (m/s) | 5.0 | 4.9 | 4.9 | 5.0 | 4.9 | 5.0 | 4.8 | 4.9 | 4.9 | 5.0 | 5.0 |
Table 14 *1001 Samples/Trial *Resistance = 7 Ohms
60 ° Leading Edge Tubercles @ 5.0 m/s- Diverter Doors @ 0°-18.0°
Average Output of Each Variable
|
Variable |
0° | 1.8° | 3.6° | 5.4° | 7.2° | 9.0° | 10.8° | 12.6° | 14.4° | 16.2° | 18.0° |
| Voltage (mV) | 1166.3 | 1178.0 | 1181.0 | 1189.0 | 1191.0 | 1204.0 | 1196.0 | 1191.0 | 1181.0 | 1165.0 | 1163.0 |
| Current (mA) | 136.3 | 137.9 | 138.9 | 139.4 | 139.5 | 140.6 | 139.6 | 139.5 | 138.5 | 135.7 | 134.7 |
| Power (mW) | 159.2 | 162.6 | 164.2 | 165.9 | 166.4 | 169.4 | 167.0 | 166.3 | 163.7 | 158.2 | 156.8 |
| Energy (mJ) | 15917.2 | 16263.2 | 16417.3 | 16590.9 | 16635.6 | 16935.6 | 16698.2 | 16633.1 | 16369.3 | 15821.4 | 15680.7 |
| Wind Speed (m/s) | 5.0 | 5.0 | 5.0 | 5.0 | 5.0 | 5.1 | 5.1 | 5.1 | 5.0 | 5.1 | 5.1 |
Table 15 *1001 Samples/Trial *Resistance = 7 Ohms
60° Leading Edge Tubercles + Nanoparticles @ 5.0 m/s- Diverter Doors @ 0°-18.0°
Average Output of Each Variable
|
Variable |
0° | 1.8° | 3.6° | 5.4° | 7.2° | 9.0° | 10.8° | 12.6° | 14.4° | 16.2° | 18.0° |
| Voltage (mV) | 1104.5 | 1112.0 | 1120.0 | 1115.0 | 1124.0 | 1124.0 | 1142.0 | 1123.0 | 1119.0 | 1103.0 | 1086.0 |
| Current (mA) | 151.2 | 152.3 | 153.4 | 152.8 | 153.8 | 153.7 | 156.2 | 153.8 | 153.2 | 151.2 | 149.1 |
| Power (mW) | 167.4 | 169.4 | 172.0 | 170.6 | 173.0 | 172.9 | 178.5 | 172.9 | 171.6 | 166.9 | 162.0 |
| Energy (mJ) | 16734.9 | 16942.6 | 17196.8 | 17059.9 | 17305.1 | 17287.0 | 17850.4 | 17289.4 | 17163.3 | 16687.8 | 16205.6 |
| Wind Speed (m/s) | 5.0 | 5.0 | 5.0 | 4.9 | 5.0 | 5.0 | 5.0 | 5.0 | 5.1 | 5.1 | 5.1 |
Table 16 *1001 Samples/Trial *Resistance = 7 Ohms
45° Trailing Edge Tubercles @ 7.5 m/s- Diverter Doors @ 0°-18.0°
Average Output of Each Variable
|
Variable |
0° | 1.8° | 3.6° | 5.4° | 7.2° | 9.0° | 10.8° | 12.6° | 14.4° | 16.2° | 18.0° |
| Voltage (mV) | 1562.45 | 1626.0 | 1617.0 | 1638.0 | 1628.0 | 1646.0 | 1641.0 | 1647.0 | 1644.0 | 1649.0 | 1567.0 |
| Current (mA) | 192.9 | 197.8 | 200.8 | 202.5 | 202.0 | 202.8 | 201.2 | 203.2 | 202.7 | 201.7 | 198.0 |
| Power (mW) | 301.4 | 321.7 | 324.7 | 331.9 | 326.0 | 333.9 | 330.2 | 334.8 | 333.3 | 332.6 | 325.3 |
| Energy (mJ) | 30137.2 | 32168.9 | 32470.1 | 33185.9 | 32597.3 | 33393.0 | 33021.9 | 33476.5 | 33331.2 | 33258.9 | 32527.7 |
| Wind Speed (m/s) | 7.4 | 7.4 | 7.3 | 7.4 | 7.3 | 7.3 | 7.3 | 7.4 | 7.4 | 7.4 | 7.3 |
Table 17 *1001 Samples/Trial *Resistance = 7 Ohms
45° Trailing Edge Tubercles + Nanoparticles @ 7.5 m/s- Diverter Doors @ 0°-18.0°
Average Output of Each Variable
|
Variable |
0° | 1.8° | 3.6° | 5.4° | 7.2° | 9.0° | 10.8° | 12.6° | 14.4° | 16.2° | 18.0° |
| Voltage (mV) | 1780.0 | 1786.0 | 1798.0 | 1814.0 | 1828.0 | 1838.0 | 1827.0 | 1834.0 | 1829.0 | 1819.0 | |
| Current (mA) | 205.6 | 208.2 | 210.2 | 211.3 | 212.6 | 213.0 | 213.5 | 213.9 | 213.0 | 211.8 | |
| Power (mW) | 366.0 | 372.0 | 378.0 | 383.3 | 388.8 | 391.5 | 390.0 | 392.2 | 389.6 | 385.4 | |
| Energy (mJ) | 36601.5 | 37200.7 | 37796.9 | 38332.3 | 38879.5 | 39149.1 | 39005.6 | 39220.0 | 38965.7 | 38540.9 | |
| Wind Speed (m/s) | 7.5 | 7.5 | 7.5 | 7.5 | 7.5 | 7.6 | 7.6 | 7.6 | 7.6 | 7.7 |
Table 18 *1001 Samples/Trial *Resistance = 7 Ohms
60° Trailing Edge Tubercles @ 7.5 m/s w/ Diverter Doors @ 0°-18.0°
Average Output of Each Variable
|
Variable |
0° | 1.8° | 3.6° | 5.4° | 7.2° | 9.0° | 10.8° | 12.6° | 14.4° | 16.2° | 18.0° |
| Voltage (mV) | 1629.0 | 1616.0 | 1638.0 | 1654.0 | 1668.0 | 1679.0 | 1677.0 | 1697.0 | 1659.0 | 1648.0 | 1634.0 |
| Current (mA) | 198.1 | 197.6 | 199.9 | 201.0 | 202.7 | 202.6 | 201.9 | 200.5 | 201.3 | 200.3 | 198.9 |
| Power (mW) | 322.3 | 319.3 | 327.5 | 332.5 | 338.2 | 340.3 | 338.6 | 340.1 | 334.1 | 330.2 | 325.1 |
| Energy (mJ) | 32275.5 | 31932.3 | 32746.3 | 33347.1 | 33817.1 | 34025.6 | 33861.9 | 34010.6 | 33414.2 | 33021.9 | 32508.6 |
| Wind Speed (m/s) | 7.9 | 7.8 | 7.8 | 7.8 | 7.9 | 7.9 | 7.9 | 8.0 | 8.0 | 8.0 | 8.1 |
Table 19 *1001 Samples/Trial *Resistance = 7 Ohms
60° Trailing Edge Tubercles + Nanoparticles @ 7.5 m/s- Diverter Doors @ 0°-18.0°
Average Output of Each Variable
|
Variable |
0° | 1.8° | 3.6° | 5.4° | 7.2° | 9.0° | 10.8° | 12.6° | 14.4° | 16.2° | 18.0° |
| Voltage (mV) | 1638.1 | 1664.0 | 1677.0 | 1682.0 | 1682.0 | 1693.0 | 1696.0 | 1681.0 | 1671.0 | 1674.0 | 1653.0 |
| Current (mA) | 203.0 | 210.0 | 211.5 | 212.3 | 212.4 | 213.9 | 214.1 | 212.1 | 210.6 | 211.2 | 208.6 |
| Power (mW) | 332.6 | 349.7 | 354.5 | 357.2 | 357.3 | 362.2 | 363.1 | 356.6 | 351.9 | 353.8 | 345.0 |
| Energy (mJ) | 33255.9 | 34966.1 | 35463.4 | 35722.3 | 35726.0 | 36222.8 | 36314.1 | 35657.5 | 35792.3 | 35377.1 | 34498.5 |
| Wind Speed (m/s) | 7.7 | 7.9 | 7.9 | 7.9 | 7.9 | 7.9 | 8.0 | 8.0 | 8.0 | 8.0 | 8.1 |
Table 20 *1001 Samples/Trial *Resistance = 7 Ohms
45° Leading Edge Tubercles @ 7.5 m/s- Diverter Doors @ 0°-18.0°
Average Output of Each Variable
|
Variable |
0° | 1.8° | 3.6° | 5.4° | 7.2° | 9.0° | 10.8° | 12.6° | 14.4° | 16.2° | 18.0° |
| Voltage (mV) | 1580.7 | 1641.0 | 1660.0 | 1677.0 | 1677.0 | 1691.0 | 1696.0 | 1700.0 | 1676.0 | 1666.0 | 1666.0 |
| Current (mA) | 195.9 | 200.3 | 202.0 | 203.8 | 203.7 | 205.3 | 205.8 | 206.0 | 203.6 | 202.1 | 202.1 |
| Power (mW) | 309.6 | 328.8 | 335.4 | 341.9 | 341.7 | 341.7 | 349.0 | 350..3 | 341.3 | 336.7 | 336.8 |
| Energy (mJ) | 30961.0 | 32880.4 | 33539.0 | 34189.2 | 34170.3 | 34712.4 | 34901.7 | 35023.4 | 34127.8 | 33673.1 | 33680.6 |
| Wind Speed (m/s) | 7.9 | 7.9 | 7.9 | 8.0 | 8.0 | 8.0 | 8.0 | 8.0 | 8.1 | 8.2 | 8.2 |
Table 21 *1001 Samples/Trial *Resistance = 7 Ohms
45° Leading Edge Tubercles + Nanoparticles @ 7.5 m/s- Diverter Doors @ 0°-18.0°
Average Output of Each Variable
|
Variable |
0° | 1.8° | 3.6° | 5.4° | 7.2° | 9.0° | 10.8° | 12.6° | 14.4° | 16.2° | 18.0° |
| Voltage (mV) | 1678.3 | 1720.0 | 1789.0 | 1798.0 | 1825.0 | 1831.0 | 1825.0 | 1818.0 | 1753.0 | 1747.0 | 1741.0 |
| Current (mA) | 192.7 | 206.3 | 204.1 | 205.5 | 207.6 | 208.0 | 209.5 | 209.9 | 214.9 | 212.7 | 211.9 |
| Power (mW) | 323.6 | 354.8 | 365.4 | 369.6 | 378.9 | 380.8 | 382.4 | 381.6 | 376.8 | 371.5 | 369.1 |
| Energy (mJ) | 32358.4 | 35485.5 | 36534.7 | 36960.8 | 37886.1 | 38080.8 | 38236.4 | 38162.1 | 37677.5 | 37052.7 | 36907.9 |
| Wind Speed (m/s) | 7.6 | 8.0 | 8.0 | 8.1 | 8.1 | 8.1 | 8.1 | 8.1 | 8.2 | 8.1 | 8.1 |
Table 22 *1001 Samples/Trial *Resistance = 7 Ohms
60 ° Leading Edge Tubercles @ 7.5 m/s- Diverter Doors @ 0°-18.0°
Average Output of Each Variable
|
Variable |
0° | 1.8° | 3.6° | 5.4° | 7.2° | 9.0° | 10.8° | 12.6° | 14.4° | 16.2° | 18.0° |
| Voltage (mV) | 1587.0 | 1569.0 | 1570.0 | 1593.0 | 1601.0 | 1599.0 | 1600.0 | 1601.0 | 1582.0 | 1572.0 | 1363.0 |
| Current (mA) | 197.0 | 196.3 | 196.0 | 196.6 | 197.5 | 197.1 | 197.3 | 197.2 | 195.0 | 193.6 | 168.4 |
| Power (mW) | 312.6 | 308.0 | 307.8 | 313.3 | 316.3 | 315.3 | 316.6 | 315.7 | 308.5 | 304.4 | 229.6 |
| Energy (mJ) | 31259.7 | 30801.2 | 30775.8 | 31332.1 | 31630.4 | 31528.6 | 31559.7 | 31573.1 | 30849.3 | 30444.2 | 22454.2 |
| Wind Speed (m/s) | 7.6 | 7.8 | 7.8 | 7.8 | 7.8 | 7.8 | 7.8 | 7.8 | 7.8 | 7.8 | 7.8 |
Table 23 *1001 Samples/Trial *Resistance = 7 Ohms
60° Leading Edge Tubercles + Nanoparticles @ 7.5 m/s- Diverter Doors @ 0°-18.0°
Average Output of Each Variable
|
Variable |
0° | 1.8° | 3.6° | 5.4° | 7.2° | 9.0° | 10.8° | 12.6° | 14.4° | 16.2° | 18.0° |
| Voltage (mV) | 1454.7 | 1515.0 | 1577.0 | 1588.0 | 1588.0 | 1679.0 | 1648.0 | 1643.0 | 1623.0 | 1466.0 | 1463.0 |
| Current (mA) | 182.7 | 182.0 | 190.2 | 191.2 | 191.5 | 183.8 | 186.7 | 186.8 | 187.7 | 196.3 | 196.3 |
| Power (mW) | 265.6 | 275.6 | 300.2 | 303.7 | 304.1 | 308.6 | 307.8 | 307.0 | 304.5 | 287.9 | 287.2 |
| Energy (mJ) | 26558.8 | 27593.0 | 30000.2 | 30374.4 | 30411.0 | 30862.7 | 30777.7 | 30700.8 | 30448.5 | 28788.5 | 28717.0 |
| Wind Speed (m/s) | 7.5 | 7.7 | 7.8 | 7.8 | 7.8 | 7.9 | 7.9 | 7.8 | 7.8 | 7.9 | 7.9 |
Table 24 *1001 Samples/Trial *Resistance = 7 Ohms
45° Trailing Edge Tubercles @ 10.0 m/s- Diverter Doors @ 0°-18.0°
Average Output of Each Variable
|
Variable |
0° | 1.8° | 3.6° | 5.4° | 7.2° | 9.0° | 10.8° | 12.6° | 14.4° | 16.2° | 18.0° |
| Voltage (mV) | 1880.0 | 1944.0 | 1967.0 | 1974.0 | 1980.0 | 1983.0 | 1968.0 | 1984.0 | 1978.0 | 1976.0 | 1951.0 |
| Current (mA) | 228.3 | 235.9 | 239.7 | 241.2 | 242.1 | 242.8 | 241.1 | 243.5 | 242.9 | 243.0 | 239.9 |
| Power (mW) | 431.1 | 458.7 | 471.5 | 476.1 | 479.5 | 481.6 | 474.5 | 483.0 | 480.6 | 480.2 | 468.1 |
| Energy (mJ) | 43106.4 | 45866.5 | 47152.3 | 47613.9 | 47945.9 | 48161.1 | 47448.9 | 48296.8 | 48056.1 | 48018.0 | 46806.1 |
| Wind Speed (m/s) | 10.3 | 10.2 | 10.6 | 10.6 | 10.6 | 10.6 | 10.5 | 10.5 | 10.6 | 10.6 | 10.6 |
Table 25
*1001 Samples/Trial
*Resistance = 7 Ohms
45° Trailing Edge Tubercles + Nanoparticles @ 10.0 m/s- Diverter Doors @ 0°-18.0°
Average Output of Each Variable
|
Variable |
0° | 1.8° | 3.6° | 5.4° | 7.2° | 9.0° | 10.8° | 12.6° | 14.4° | 16.2° | 18.0° | 19.8° | 21.6° |
| Voltage (mV) | 1969.0 | 1974.0 | 1993.0 | 2006.0 | 2017.0 | 2027.0 | 2027.0 | 2029.0 | 2029.0 | 2028.0 | 2027.0 | 2010.0 | |
| Current (mA) | 237.4 | 238.6 | 241.2 | 243.2 | 244.7 | 246.0 | 246.1 | 246.1 | 246.2 | 246.1 | 245.6 | 243.7 | |
| Power (mW) | 467.4 | 471.0 | 480.8 | 488.0 | 493.5 | 498.7 | 499.1 | 499.3 | 499.7 | 499.3 | 497.7 | 489.9 | |
| Energy (mJ) | 46741.8 | 47100.2 | 48080.1 | 48794.6 | 49353.9 | 49872.2 | 49908.3 | 49931.5 | 49973.4 | 49929.0 | 49771.4 | 48991.2 | |
| Wind Speed (m/s) | 10.4 | 10.4 | 10.5 | 10.5 | 10.5 | 10.6 | 10.6 | 10.6 | 10.6 | 10.6 | 10.8 | 10.8 |
Table 26
*1001 Samples/Trial
*Resistance = 7 Ohms
60° Trailing Edge Tubercles @ 10.0 m/s w/ Diverter Doors @ 0°-18.0°
Average Output of Each Variable
|
Variable |
0° | 1.8° | 3.6° | 5.4° | 7.2° | 9.0° | 10.8° | 12.6° | 14.4° | 16.2° | 18.0° |
| Voltage (mV) | 1808.9 | 1830.0 | 1849.0 | 1862.0 | 1876.0 | 1886.0 | 1906.0 | 1911.0 | 1923.0 | 1885.0 | 1845.0 |
| Current (mA) | 224.2 | 226.2 | 228.9 | 229.6 | 231.0 | 231.1 | 232.3 | 231.4 | 229.4 | 231.0 | 231.6 |
| Power (mW) | 405.5 | 413.9 | 423.3 | 427.5 | 433.3 | 435.7 | 442.7 | 442.4 | 441.1 | 435.5 | 427.2 |
| Energy (mJ) | 40551.5 | 41388.3 | 42328.9 | 42754.2 | 43329.9 | 43576.9 | 44269.8 | 44237.4 | 44109.0 | 43548.3 | 42719.9 |
| Wind Speed (m/s) | 10.1 | 10.3 | 10.4 | 10.4 | 10.5 | 10.5 | 10.7 | 10.7 | 10.8 | 10.7 | 10.8 |
Table 27
*1001 Samples/Trial
*Resistance = 7 Ohms
60° Trailing Edge Tubercles + Nanoparticles @ 10.0 m/s- Diverter Doors @ 0°-18.0°
Average Output of Each Variable
|
Variable |
0° | 1.8° | 3.6° | 5.4° | 7.2° | 9.0° | 10.8° | 12.6° | 14.4° | 16.2° | 18.0° |
| Voltage (mV) | 1829.7 | 1844.0 | 1859.0 | 1876.0 | 1885.0 | 1842.0 | 1893.0 | 1894.0 | 1888.0 | 1873.0 | 1856.0 |
| Current (mA) | 227.6 | 233.1 | 234.8 | 237.0 | 238.2 | 239.0 | 239.2 | 239.1 | 238.3 | 236.3 | 234.2 |
| Power (mW) | 416.5 | 430.0 | 436.5 | 444.7 | 449.0 | 452.7 | 452.9 | 452.8 | 450.1 | 442.7 | 434.7 |
| Energy (mJ) | 41654.2 | 43003.9 | 43653.2 | 44472.4 | 44904.5 | 45267.3 | 45290.9 | 45277.6 | 45008.0 | 44270.8 | 43474.2 |
| 43474.2Wind Speed (m/s) | 10.1 | 10.2 | 10.2 | 10.3 | 10.3 | 10.3 | 10.3 | 10.4 | 10.4 | 10.4 | 10.4 |
Table 28
*1001 Samples/Trial
*Resistance = 7 Ohms
45° Leading Edge Tubercles @ 10.0 m/s- Diverter Doors @ 0°-18.0°
Average Output of Each Variable
|
Variable |
0° | 1.8° | 3.6° | 5.4° | 7.2° | 9.0° | 10.8° | 12.6° | 14.4° | 16.2° | 18.0° |
| Voltage (mV) | 1830.7 | 1847.0 | 1813.0 | 1868.0 | 1871.0 | 1862.0 | 1841.0 | 1848.0 | 1847.0 | 1845.0 | 1837.0 |
| Current (mA) | 221.4 | 223.1 | 224.0 | 225.1 | 225.7 | 224.7 | 222.2 | 222.6 | 222.4 | 223.7 | 222.6 |
| Power (mW) | 404.1 | 412.6 | 416.8 | 420.5 | 422.2 | 418.4 | 412.2 | 411.3 | 410.7 | 412.6 | 409.0 |
| Energy (mJ) | 40409.6 | 41203.0 | 41676.5 | 42055.4 | 42216.7 | 41834.4 | 41216.3 | 41131.6 | 41074.4 | 41262.7 | 40896.8 |
| Wind Speed (m/s) | 10.0 | 10.1 | 10.1 | 10.2 | 10.1 | 10.2 | 10.2 | 10.2 | 10.3 | 10.4 | 10.4 |
Table 29
*1001 Samples/Trial
*Resistance = 7 Ohms
45° Leading Edge Tubercles + Nanoparticles @ 10.0 m/s- Diverter Doors @ 0°-18.0°
Average Output of Each Variable
|
Variable |
0° | 1.8° | 3.6° | 5.4° | 7.2° | 9.0° | 10.8° | 12.6° | 14.4° | 16.2° | 18.0° |
| Voltage (mV) | 1883.3 | 1918.0 | 1964.0 | 1985.0 | 1997.0 | 2009.0 | 2014.0 | 2018.0 | 2011.0 | 2011.0 | 1960.0 |
| Current (mA) | 234.5 | 237.8 | 242.6 | 245.4 | 246.9 | 248.2 | 248.9 | 249.2 | 248.2 | 248.1 | 241.2 |
| Power (mW) | 441.6 | 456.0 | 476.5 | 487.1 | 493.2 | 498.7 | 501.4 | 502.9 | 499.0 | 499.1 | 472.8 |
| Energy (mJ) | 44162.8 | 45599.0 | 47646.7 | 48714.4 | 49317.8 | 49874.3 | 50136.4 | 50285.9 | 49904.2 | 49911.2 | 47283.9 |
| Wind Speed (m/s) | 10.4 | 10.5 | 10.5 | 10.6 | 10.7 | 10.7 | 10.7 | 10.7 | 10.7 | 10.7 | 10.5 |
Table 30
*1001 Samples/Trial
*Resistance = 7 Ohms
60 ° Leading Edge Tubercles @ 10.0 m/s- Diverter Doors @ 0°-18.0°
Average Output of Each Variable
|
Variable |
0° | 1.8° | 3.6° | 5.4° | 7.2° | 9.0° | 10.8° | 12.6° | 14.4° | 16.2° | 18.0° |
| Voltage (mV) | 1777.6 | 1835.0 | 1829.0 | 1806.0 | 1820.0 | 1821.0 | 1807.0 | 1783.0 | 1771.0 | 1765.0 | 1758.0 |
| Current (mA) | 217.2 | 215.7 | 213.3 | 215.3 | 215.5 | 216.0 | 217.4 | 218.6 | 219.8 | 218.4 | 217.2 |
| Power (mW) | 386.1 | 395.8 | 390.1 | 389.0 | 392.1 | 393.3 | 393.0 | 389.8 | 389.9 | 385.5 | 382.0 |
| Energy (mJ) | 38611.4 | 39584.8 | 39012.7 | 38896.0 | 39209.2 | 39333.5 | 39300.5 | 38980.4 | 38944.7 | 38554.6 | 38204.3 |
| Wind Speed (m/s) | 10.4 | 10.4 | 10.0 | 10.0 | 10.0 | 10.1 | 10.1 | 10.1 | 10.1 | 10.1 | 10.2 |
Table 31
*1001 Samples/Trial
*Resistance = 7 Ohms
60° Leading Edge Tubercles + Nanoparticles @ 10.0 m/s- Diverter Doors @ 0°-18.0°
Average Output of Each Variable
|
Variable |
0° | 1.8° | 3.6° | 5.4° | 7.2° | 9.0° | 10.8° | 12.6° | 14.4° | 16.2° | 18.0° |
| Voltage (mV) | 1739.6 | 1753.0 | 1773.0 | 1800.0 | 1819.0 | 1829.0 | 1831.0 | 1835.0 | 1835.0 | 1834.0 | 1822.0 |
| Current (mA) | 205.0 | 210.0 | 215.8 | 217.5 | 219.2 | 219.6 | 220.4 | 220.7 | 219.8 | 219.0 | 216.7 |
| Power (mW) | 356.5 | 368.1 | 382.5 | 391.6 | 398.9 | 401.6 | 403.7 | 404.9 | 403.3 | 401.8 | 394.9 |
| Energy (mJ) | 35651.0 | 36811.2 | 38248.6 | 39160.6 | 39886.6 | 40164.8 | 40369.1 | 40489.6 | 40328.4 | 40175.7 | 39487.5 |
| Wind Speed (m/s) | 10.1 | 10.2 | 10.3 | 10.4 | 10.6 | 10.5 | 10.6 | 10.5 | 10.6 | 10.6 | 10.6 |
Table 32
*1001 Samples/Trial
*Resistance = 7 Ohms
Recent Comments